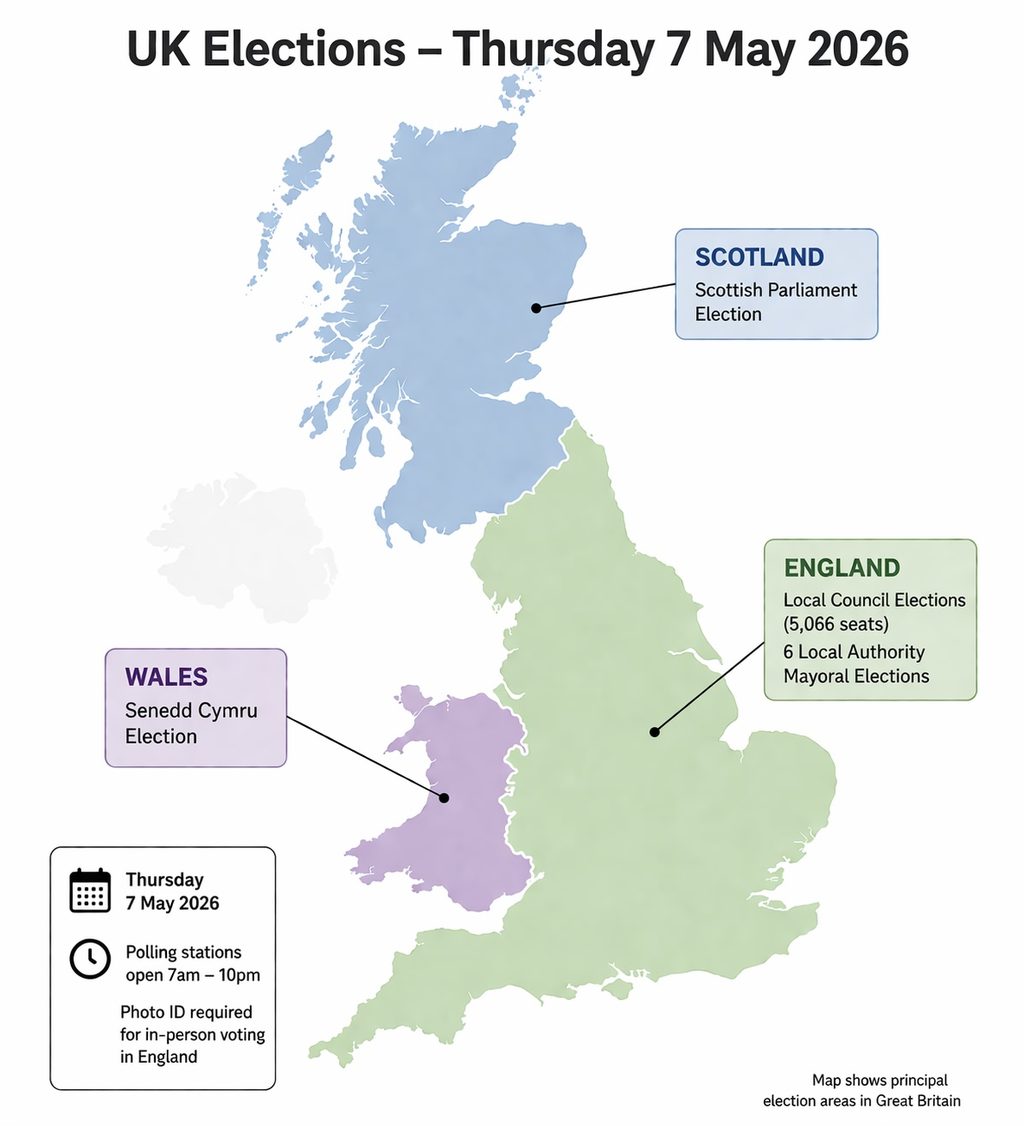
Voters across Great Britain will head to the polls on Thursday 7 May in one of the broadest and most politically varied election days of the current cycle, with contests ranging from English town halls and county councils to the Scottish Parliament and a newly expanded Senedd in Wales. Polling stations will be open from 7 am to 10 pm. In England, voters going to polling stations must bring accepted photo ID. That requirement does not apply to the Scottish Parliament election or the Senedd election, and it does not apply to the two Welsh local by-elections taking place the same day.
Taken together, the elections amount to the first large-scale electoral test of party organisation and public mood since Labour entered government, but they are also something less familiar than a straight midterm verdict. The map is unusually fragmented. Labour is defending a heavy local base built partly on its stronger 2022 performance. The Conservatives are exposed in shire counties, outer London and commuter-belt councils. Reform UK is trying to turn national polling strength into seats, councillors and control of local authorities. The Liberal Democrats are targeting anti-Conservative territory in the south. The Greens are looking to convert rising vote shares into control in parts of London and in university and progressive towns. Independents and localist groups remain important in a number of places where neither Westminster nor national polling tells the whole story.
The official picture is clearer on what is being elected than on what the results will be. The Electoral Commission lists elections on 7 May for local government in England, six English local authority mayoral contests, the Scottish Parliament and Senedd Cymru. In England, Democracy Club’s aggregation of Statements of Persons Nominated from returning officers shows 136 councils holding elections, with 5,066 councillor seats across 2,969 wards and divisions once scheduled contests and additional vacancies are combined. Election Maps UK and PollCheck use a slightly lower scheduled total of about 4,992 councillors because they classify some vacancies differently. Democracy Club records 25,046 candidates in the English local elections, representing 140 parties, plus 794 independents. It says its data was compiled from 2,969 Statements of Persons Nominated published on council websites on 9 and 10 April.
Those English contests cover every kind of local battleground. All 32 London boroughs are holding all-out elections, accounting for 1,817 seats, and five London borough mayoralties are being fought at the same time. Elsewhere, 32 metropolitan boroughs are involved, 18 unitary authorities are electing councillors, six county councils are voting all-out, and 48 district councils are on the ballot through a mix of all-out, halves and thirds systems. Alongside those scheduled elections, Democracy Club identifies 18 standalone English local by-elections and two Welsh local by-elections, in Newport and Powys. Most English authorities are not voting this year because their cycles fall in other years, while Scotland and Wales are electing devolved legislatures rather than ordinary local councils. Northern Ireland has no scheduled equivalent poll on this date.
The final official source for who is standing remains each returning officer’s Statement of Persons Nominated. What comes after that is a mixture of polling, demographic modelling, local history and analytical judgement. One of the most widely cited attempts to convert that into an English local map is PollCheck, which projects 59 changes of council control across the 136 English authorities voting. PollCheck stresses that its work is a model rather than ward-by-ward polling. It combines national polling, Britain Elects estimates, local election history, demographic patterns, candidate data and boundary information, which makes it useful for risk and direction, but still vulnerable to local shocks.
The national polling backdrop helps explain why so many councils are in play. A late-April YouGov Westminster voting-intention survey put Reform UK on 26 per cent, the Conservatives on 19 per cent, Labour on 18 per cent, the Greens on 15 per cent and the Liberal Democrats on 13 per cent. Ipsos, in a separate April poll, also found Reform first on 25 per cent, with Labour and the Conservatives tied on 19 and the Greens on 17. Those are not local election forecasts, but they reinforce a picture of a five-party field in which vote fragmentation can produce abrupt seat changes under first-past-the-post.
That fragmentation is one reason these elections may look larger in seats than in votes. In English local government, many wards are multi-member, turnout is lower than at Westminster, and councils vote on different cycles. Local incumbents, community campaigns, independents, candidate quality and tactical voting can all have an outsized effect. The same vote share that produces a modest movement in national polling can, in the right place, flip a borough, a county or an all-out metropolitan council.
For Labour, the difficulty is partly mechanical and partly political. Election Maps UK and PollCheck count the party as defending 2,196 English seats, by far the largest burden of any party. Many of those seats were last fought in 2022, when Labour’s local position was stronger. Current polling is weaker. Ipsos recorded government satisfaction at minus 62 in April and Sir Keir Starmer’s net satisfaction at minus 56. Those figures do not determine local results, but they add weight to the argument that Labour is defending gains under less favourable conditions than when they were won.
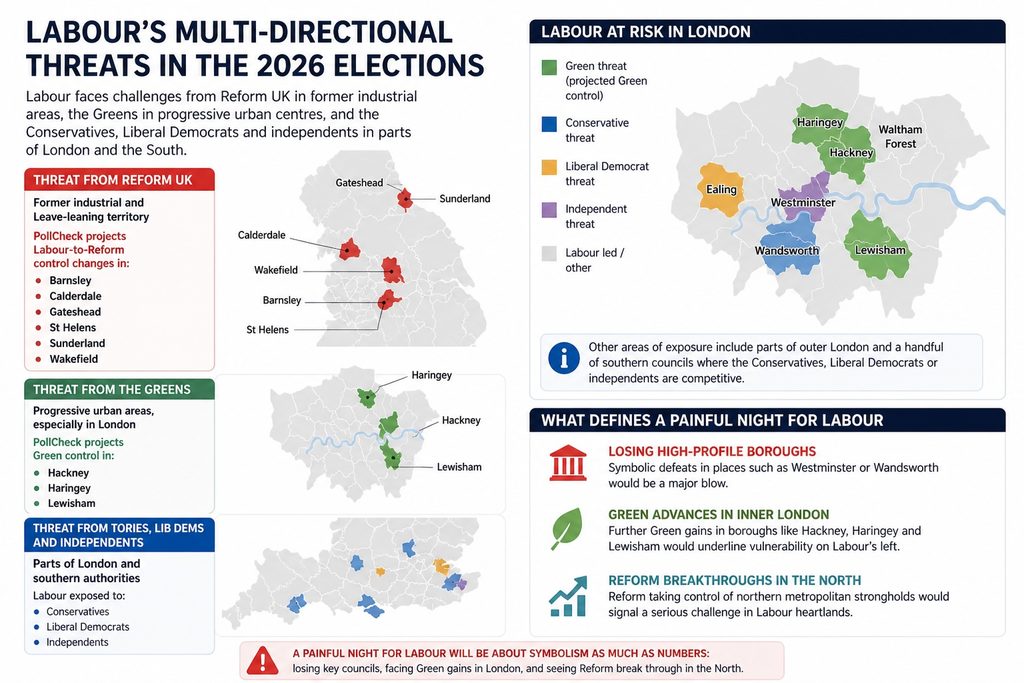
The threats to Labour are not concentrated in one direction. In former industrial and Leave-leaning territory, Reform is the direct challenger. PollCheck projects Labour-to-Reform control changes in Barnsley, Calderdale, Gateshead, St Helens, Sunderland and Wakefield. In progressive urban areas, especially in London, the Greens are the main danger. PollCheck projects Green control in Hackney, Haringey and Lewisham. In parts of the capital and a handful of southern authorities, Labour is also exposed to the Conservatives, the Liberal Democrats and well-organised independents. A painful night for Labour would not be defined only by raw seat losses. It would be defined by the symbolism of losing boroughs such as Westminster or Wandsworth, seeing Green advances in inner London, and suffering Reform breakthroughs in northern metropolitan strongholds.
The Conservatives face a different version of the same pressure. They are defending 1,134 English seats, with the greatest exposure in counties, suburban districts and outer London boroughs. Their threat map is split in two. Reform is strongest in Leave-leaning counties, coastal authorities and ex-Conservative towns. The Liberal Democrats, and in some places the Greens or Labour, are targeting affluent commuter belts and metropolitan areas where tactical anti-Conservative voting has been effective before. PollCheck projects Conservative losses in Essex, Norfolk, Suffolk, Hampshire, West Sussex and the two newly created Surrey unitaries, East Surrey and West Surrey. It also projects slippage in outer London, including Bexley and Bromley. At the same time, the party has identifiable recovery opportunities, most notably Westminster and possibly Barnet, where London modelling suggests a stronger Conservative showing than Labour would want.
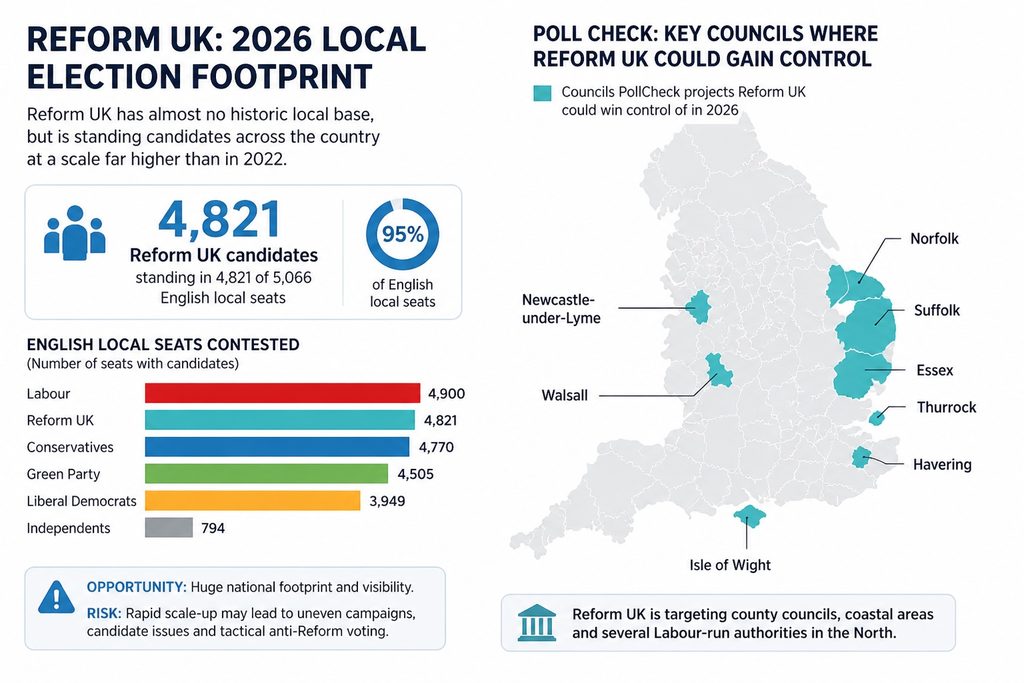
Reform UK enters the elections with almost no historic local base compared with the older parties, but with a much broader organisational footprint than it had at the last comparable cycle. Democracy Club records Reform candidates in 4,821 of the 5,066 English local seats identified in its dataset. That is only slightly below Labour’s 4,900 and above the Conservatives’ 4,770. The Greens are standing in 4,505 and the Liberal Democrats in 3,949. The breadth of that Reform coverage is one of the most important hard facts of the campaign. Whether it turns into councils is a separate question. Reform’s risk is that rapid scale-up produces weak local organisation, uneven ground campaigns or candidate problems, and that tactical anti-Reform voting hardens at ward level. But the opportunity is obvious. PollCheck’s highest-profile projected Reform gains include Essex, Norfolk and Suffolk county councils, Thurrock, Isle of Wight, Newcastle-under-Lyme, Walsall, Havering and several northern Labour authorities.
The Liberal Democrats, by contrast, are pursuing a more familiar local election strategy: concentrated targeting, incumbency and careful ward selection rather than broad national reach. They are defending councils such as Richmond upon Thames, Kingston upon Thames, Sutton, Cheltenham, Eastleigh, St Albans, South Cambridgeshire, Tunbridge Wells, Winchester, Wokingham and Watford. Their opportunities lie in East and West Surrey, Hampshire, West Sussex, Merton, Three Rivers, Welwyn Hatfield, Cherwell and other anti-Conservative suburbs and commuter districts. The Surrey reorganisation adds an extra layer of uncertainty because voters are electing councillors for new unitary authorities rather than the old county and district structure.
The Greens enter the day with fewer councillors to defend than Labour, the Conservatives or the Liberal Democrats, but with a stronger polling environment than in 2022 and an expanding map. Election Maps UK and PollCheck count them as defending 170 English seats. PollCheck projects Green control in Hackney, Haringey, Lewisham and Hastings. Its wider watchlist includes Norwich, Sheffield, Cambridge, Oxford and Worthing. The danger for the Greens is inefficient distribution: a high vote share can create many second places and many no-overall-control councils without quite tipping authorities into Green control. The opportunity is sharpest where Labour is unpopular with progressive voters and where Green organisation is already substantial.
Nowhere is that multi-party compression more visible than in London. All 32 boroughs are voting all-out and five borough mayoralties are on the same ballot. The capital delivered Labour gains in places such as Westminster, Wandsworth and Barnet in 2022. In 2026 it looks much less straightforward. YouGov’s London local election MRP, based on fieldwork from late March to late April, put Labour on 26 per cent across the capital, the Greens on 22, the Conservatives on 17, the Liberal Democrats on 15 and Reform on 14. That is a vote-share model, not a seat forecast, but it suggested Labour would be the largest party in only 15 boroughs in the median projection, down from the much broader Labour map that emerged after 2022.
The boroughs to watch read like a catalogue of different kinds of pressure. PollCheck projects Westminster returning to Conservative control and Wandsworth moving to no overall control. YouGov’s London model suggests Barnet could see a Conservative largest-party recovery. Hackney, Haringey and Lewisham are the clearest Green breakthrough opportunities. Havering, long shaped by residents’ groups and other non-mainstream forces, is projected by PollCheck to move from localist control to Reform. Bexley and Bromley are vulnerable to fragmentation on the right. Merton looks highly competitive between Labour and the Liberal Democrats. Brent, Camden, Lambeth, Southwark, Waltham Forest and Greenwich all sit somewhere on a scale from pressure to serious risk for Labour. Tower Hamlets and Newham remain their own categories, shaped by local alliances, independent slates and community politics as much as by national party labels.
That localism matters. Democracy Club’s candidate data shows substantial slates for Newham Independents, Aspire and Tower Hamlets Independents, and there are meaningful independent and localist presences in Bradford, Oldham, Rochdale and Havering. In some boroughs and cities, especially where anger over Gaza has overlapped with local grievances over services and representation, Muslim and community-based independents are seen as a particular risk to Labour. The evidence for how far that translates into seats will come only at ward level, but the organisational presence is real enough to shape the contest.
The six local authority mayoral elections underline the same point. In Croydon, Conservative mayor Jason Perry is defending the post against a field that includes Labour’s Rowenna Davis, Reform’s Ben Flook, Liberal Democrat Richard Howard and Green candidate Peter Underwood. Croydon’s politics cannot be separated from its finances: the borough says it had previously issued two Section 114 notices and still carries a general fund debt burden of about £1.4 billion. Hackney’s mayoral race pits Labour’s Caroline Woodley against a strong Green challenge led by Zoë Garbett, with Reform, Conservative and Liberal Democrat candidates also in the field. Lewisham has a similar Labour-versus-Green dynamic within a broader fragmented contest. In Newham, where Rokhsana Fiaz is not standing again, Labour’s Forhad Hussain faces not only Conservative, Green, Liberal Democrat and Reform opponents but also Kamran Malik for Communities United and Mehmood Mirza for Newham Independents. In Tower Hamlets, Aspire’s Lutfur Rahman is seeking re-election against Labour’s Sirajul Islam, Tower Hamlets Independents candidate Zami Ali and others. In Watford, Liberal Democrat mayor Peter Taylor is defending against Conservative, Labour, Reform, Green and independent challengers. Tower Hamlets has already published one of the clearest count timetables: verification begins at 8.30 am on Friday, mayoral counting is expected from 1.30 pm that day, and council ward counting begins on Saturday morning.
Outside London, the English regional picture is wide and uneven. In the South East, the story is the three-way squeeze on the Conservatives. Hampshire, West Sussex and both new Surrey unitaries are projected to move to no overall control, while the Isle of Wight is projected to go to Reform. East Sussex is also modelled as no overall control. In the South West, where fewer councils are voting, Plymouth is projected as a Labour hold, Cheltenham as a Liberal Democrat hold, and Exeter and Swindon as slipping to no overall control. In the East of England, the most dramatic tests are the counties. Essex, Norfolk and Suffolk are Reform’s clearest county-control opportunities in any modelled map, and Thurrock is another prominent Reform target. Basildon, Harlow, Peterborough and Southend-on-Sea are among the more volatile authorities where the eventual balance could hinge on how fragmented the vote becomes.
The West Midlands may provide the clearest measure of whether Reform can convert regional polling strength into council power. YouGov’s West Midlands MRP put Reform on 30 per cent regionally and showed it in contention to top all 13 council areas it sampled, with clear double-digit leads in seven: Cannock Chase, Dudley, Newcastle-under-Lyme, Nuneaton and Bedworth, Redditch, Tamworth and Walsall. PollCheck projects Reform control in Newcastle-under-Lyme and Walsall, with Birmingham, Coventry, Cannock Chase, Redditch, Rugby, Nuneaton and Tamworth all moving or remaining in no overall control. Birmingham carries its own financial backdrop after issuing Section 114 notices in 2023 and coming under commissioner intervention, which makes it one of the night’s most closely watched tests of how local service failures intersect with national party loyalties.
The North of England contains some of Labour’s sharpest risks and some of Reform’s biggest opportunities. In the North West, PollCheck projects Labour holds in Manchester, Knowsley, Halton, Preston, Wigan, Sefton and Trafford, but no overall control in Blackburn with Darwen, Hyndburn, Rochdale, Tameside and West Lancashire, and a Reform gain in St Helens. In the North East, Gateshead and Sunderland are projected Reform gains, Hartlepool and South Tyneside no overall control, and North Tyneside a Labour gain from no overall control. In Yorkshire and the Humber, Barnsley, Calderdale and Wakefield are all projected to go to Reform, while Bradford and Leeds are projected to fall to no overall control and Sheffield and Kirklees to remain there. PoliticsHome’s reporting from Bradford has underlined that the challenge to Labour there is not reducible to one issue: anger over Gaza exists alongside discontent about local services and the economy, and independents are expecting to benefit.
The local issues research helps explain why the map does not align neatly with Westminster narratives. YouGov’s polling on what matters in local elections found roads and potholes, the economy and cost of living, and NHS, GP and hospital services at the top overall. Reform voters were especially focused on immigration and council tax. Green voters showed unusually high concern about racism and far-right politics. That mix helps explain why parties can perform very differently in neighbouring councils and why local grievances, from road repairs to bin collections to municipal debt, can be politically decisive.
Beyond England, the other two national stories may be just as consequential. Scotland is electing all 129 members of Holyrood, with 73 constituency MSPs and 56 regional list MSPs. Before dissolution, Holyrood’s composition stood at 60 SNP, 28 Conservatives, 20 Labour, seven Greens, five Liberal Democrats, one Reform MSP, seven independents and one no-party MSP. The central question is whether the SNP can secure an outright majority or whether it will again need support from the Greens or others. Here, too, the modelling diverges. YouGov’s Scottish MRP gave the SNP 67 seats in its central estimate, enough for a narrow majority, with Reform on 20, Labour on 15, the Greens on 11, the Liberal Democrats on nine and the Conservatives on eight. More in Common’s MRP was more cautious, with the SNP on 56, Reform on 22, Labour on 17, the Liberal Democrats on 14, the Conservatives on 12 and the Greens on eight. PollCheck’s five-poll average on 4 May put the SNP clearly first on vote share, with Labour and Reform tied on 17.8 per cent. The common thread is that the SNP remains ahead, Reform is poised to make gains mainly through the regional lists rather than constituencies, and the contest for second place may matter almost as much as the contest for first.
Wales is voting under a new system and may produce the most dramatic parliamentary reordering of the day. From 2026, the Senedd expands from 60 to 96 members, elected from 16 six-member constituencies by closed-list proportional representation using D’Hondt. Voters get one vote for a party list or independent candidate. Before the election, the 60-seat Senedd was made up of 29 Labour members, 13 Conservatives, 13 Plaid Cymru, one Liberal Democrat, two Reform and two independents. Polling suggests that history may now matter less than the new rules. PollCheck’s five-poll average put Plaid on 29.2 per cent and Reform on 27.6, with Labour down at 13.8. YouGov’s Senedd MRP projected Reform on 37 seats, Plaid on 36, Labour on 12, the Greens on seven, the Conservatives on three and the Liberal Democrats on one. Another seat projection based on recent poll averages put Plaid first on 35, Reform on 32 and Labour on 16. What all of these models share is the idea that Labour’s old constituency advantage has been sharply reduced, Plaid could lead the Welsh Government for the first time, Reform could emerge as the largest party or official opposition, and no party is likely to reach the 49 seats required for a majority. Coalition or support arrangements look probable.
Those devolved systems also illustrate one of the broader themes of the election day. Reform, like the Greens, may find proportional or list systems more forgiving than English local wards, where concentrated tactical opposition and first-past-the-post mechanics can leave strong vote shares under-rewarded. By the same token, English councils can produce visually dramatic control changes from relatively modest vote shifts, especially where five parties and independents are dividing the electorate.
Results will not all arrive at once. Some local councils count overnight, but many will declare on Friday, and county councils often take much of the day. Tower Hamlets has already confirmed a Friday and Saturday schedule. The earliest useful clues are likely to come not from national vote estimates but from a string of local bellwethers: Essex, Norfolk and Suffolk for Reform’s county test; Barnsley, Sunderland, Wakefield and St Helens for Labour’s northern vulnerability; Birmingham, Walsall and Newcastle-under-Lyme for the West Midlands; Westminster, Wandsworth and Barnet for the shape of London; Hackney, Haringey and Lewisham for the Greens; Merton, Richmond, Kingston, Sutton and Watford for Liberal Democrat resilience; Bradford, Newham and Tower Hamlets for independents and localist challengers; Holyrood constituency declarations for the SNP’s majority chances; and the Senedd’s first-place race for whether Wales turns towards Plaid, Reform or neither.
By Friday, Britain should know much more than which party won which council. It should know whether Reform’s national rise can be institutionalised in local government, whether Labour’s coalition can hold together under the pressures of office, whether the Conservatives can resist a squeeze from both sides, whether the Greens can turn momentum into authority, whether the Liberal Democrats can continue to outperform in their chosen terrain, and whether Scotland and Wales are heading into very different parliamentary futures. What is certain already is that this is no longer a two-party story. The official documents show a sprawling ballot paper. The models point to an unsettled electorate. The results, when they arrive, are likely to show how far Britain’s fractured politics has travelled from Westminster into every layer of government.


Join the Discussion
Have something to say? Join the conversation!
Sign in to share your thoughts and engage with other readers.
Sign In Create AccountNo comments yet
Be the first to share your thoughts on this article!